A recent special report by the U.S. Census Bureau paints a portrait of the oldest Americans. Centenarians (people 100 years or older) share a different demographic profile than the rest of the senior population. Between 1980 and 2010, their numbers grew at a rate almost twice as fast as the general population, from 32,194 to 53,364. This growth represented a 65.8 percent rise compared to a 36.3 percent increase for the total U.S. population.
As one might expect, most centenarians are between 100 and 104 years old. The census reported that 62 percent of those 100 and older are 100 or 101, while 92 percent are 100 to 104 years old. Supercentenarians (those 110 or older) are very rare, numbering just 330 in the entire country.
Overall, centenarians are more likely to be female than male. Females comprise roughly 80 percent of the 100+ population.
The centenarian lifestyle
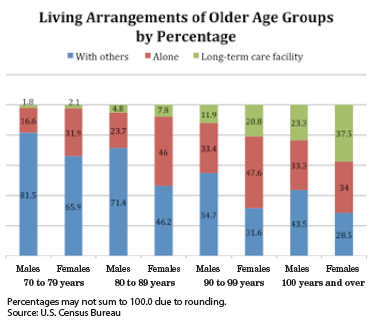
Living arrangements change as people get older and lose a spouse or experience a disability. Even so, only about a third of this age group live in long-term care facilities. Roughly two-thirds live in households by themselves or with others.
More centenarians live in the Southern U.S. than in any other region, followed by the Midwest and Northwest, with the West having the smallest population of those 100 and older. Nevertheless, more than one in ten American centenarians reside in California.
New York and Florida are the next most highly represented states, each with over 4,000 persons at least 100 years of age. For more data about centenarians, visit the U.S. Census Bureau’s website at www.census.gov.
The takeaway for gift planners
From an estate gift perspective, the 100-year-old and older population represents the relative “outliers” that live far beyond average life expectancies, thereby extending the wait for gifts that mature or vest at the death of an individual. Nonetheless, increasing longevity trends among the 65+, 75+ and 85-and-beyond population groups should be taken into account when determining both current and future returns on fundraising investments.
When considering marketing decisions for this demographic, keep in mind the physical limitations older persons typically experience, especially impaired vision, mobility and hearing.
Sharpe’s publications and planned giving websites are carefully written and designed with these considerations in mind. Visit www.sharpenet.com or call 901-680-5300 to learn more about Sharpe’s communications services.
