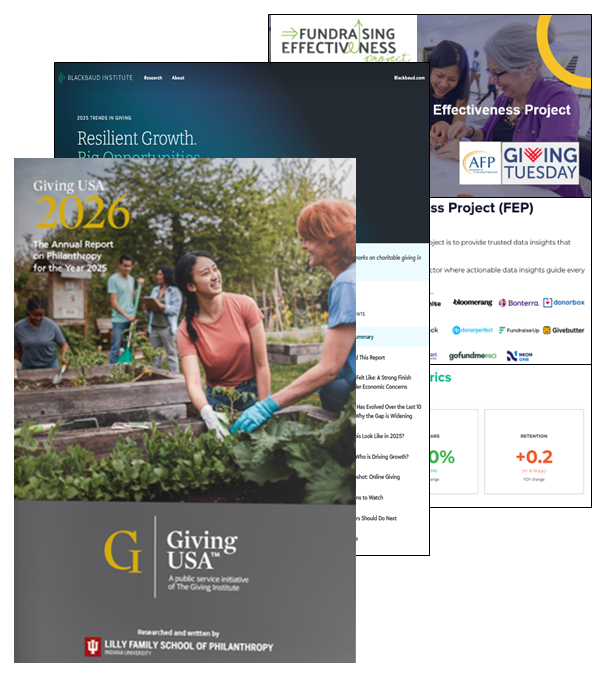
 While Giving USA’s Annual Report on Philanthropy is the oldest and most followed report on the nation’s philanthropic activities, it has been joined by several other fundraising reports in recent years, including the Fundraising Effectiveness Project report, sponsored by the Association of Fundraising Professionals (AFP) Foundation for Philanthropy and GivingTuesday, and the Trends in Giving report, conducted by Blackbaud Institute.
Examining these three annual philanthropic studies provides a more diverse and richer picture of what occurred in charitable giving in America last year. Collectively, the reports can also provide additional benchmarks by which to measure your program in 2026 as well as alert you to trends that may impact giving in the second half of the year.
Giving USA
Recently, Giving USA 2026: The Annual Report on Philanthropy for the Year 2025 released the initial set of estimates of charitable giving sources and recipients. The overall picture is similar to what we have seen in recent years, but the full report contains a wealth of data researched and written by the Lilly Family School of Philanthropy. Here are a few highlights from the report:
2025 Charitable Giving by Source
Source | Up/Down | Amount Given | Adjusted for Inflation |
Total | ↑ 5.7% | $617.20 billion | ↑ 3.0% |
Individuals | ↑ 4.1% | $394.2 billion | ↑ 1.4% |
Foundations | ↑ 5.7% | $117.15 billion | ↑ 3.0% |
Bequests | ↑ 19.7% | $62.19 billion | ↑ 16.6% |
Corporations | ↑ 3.1% | $43.67 billion | = +0.5%* |
*Change of less than +/- 1% is considered flat. | |||
2025 Charitable Giving to Recipients/Uses
Type of recipient organization | Up/Down | Amount Given | Adjusted for Inflation |
Religion | ↑ 2.4% | $151.58 billion | = -0.2%* |
Human Services | ↑ 5.3% | $99.50 billion | ↑ 2.6% |
Education | ↑ 11.7% | $92.01 billion | ↑ 8.9% |
Foundations | ↓ 16.2% | $79.05 billion | ↓ 18.3% |
Public-Society Benefit | ↑ 11.6% | $72.06 billion | ↑ 8.7% |
Health | ↑ 6.1% | $61.43 billion | ↑ 3.3% |
International Affairs | ↑ 4.1% | $33.02 billion | ↑ 1.4% |
Arts, Culture, Humanities | ↑ 7.5% | $27.31 billion | ↑ 4.7% |
Environment and Animals | ↑ 11.0% | $24.57 billion | ↑ 8.2% |
*Change of less than +/- 1% is considered flat. | |||
Giving by Bequest led the way year over year with an increase of nearly 20% in 2025. The Giving USA data tables show that charitable bequests exceeded $50 billion for the first time in 2022 and averaged more than $60 billion annually over the past three years. The five-year average for Bequest giving also averages more than $56 billion per year! These figures may indicate that the much-anticipated wealth transfer is accelerating.
Other items of note:
- 2021 was the actual biggest overall year when adjusted for inflation, but 2025 is the second biggest on record in current dollars.
- Bequests were up almost 20% year over year. Both 3- and 5-year trends for Bequest giving were very strong.
- Overall Bequest contributions for 2025 were 10% vs. 8% in 2024.
Fundraising Effectiveness Project
The Fundraising Effectiveness Project (FEP) is a collaboration between the AFP Foundation for Philanthropy and Giving Tuesday. The FEP reported strong overall growth of 5.0%. Unfortunately, there were fewer donors, with the overall number declining by 3.6%. Donor retention was basically flat at 0.2%.
Fewer donors making larger gifts continues a trend that began during the pandemic and shows new donor acquisition continues to be challenging, making new and lapsed donor acquisition a priority for many fundraising programs.
In the short term, consistency among regular, mid-range, major and supersized donors is essential to gift revenue, but long-range sustainability includes growth by donor acquisition and retention.
This may require a more sophisticated segmentation for effectively attracting new donors of different generations to your mission and the use of a variety of communication channels to create and foster long-term donor relationships that will follow each donor’s economic and philanthropic lifecycle.
Blackbaud Institute’s Trends in Giving
2025 Trends in Giving is a project of the Blackbaud Institute and is drawn from more than 7,500 nonprofits. Thanks to a strong fourth-quarter finish, the year ended up with a weighted median growth of 4.3%, yet fundraising performances diverged considerably based on organizational and gift sizes.
Larger nonprofits generally fared better, particularly with donors giving more than $1,000 and those making even larger gifts. The fourth quarter totaled more than 36% of annual gift revenue, and the month of December provided 18% of all gifts!
Mid-level and major gifts accounted for between 84% to more than 90% of gift dollars (for small-84%, medium-90%, large 93%).
What this may mean for 2026 and beyond
The results from these three reports should provide some food for thought for the remainder of the year. Charitable giving is still primarily driven by people who are making decisions, whether the funds come from individuals, corporations, foundations or estates.
Whether you follow a calendar or fiscal year, it will be important to make your fundraising plans now for the last quarter of 2026, the period that is usually the most generous time of the year for your donors.
And looking ahead to next year and beyond, consider your overall fundraising approach and fine-tune your efforts to acknowledge the role of donor segmentation for small, medium and large gifts. It’s time-tested advice that first appeared in a Give & Take newsletter from Sharpe Group founder, Bob Sharpe Sr., who suggested taking a “planned giving approach” to secure larger current and deferred gifts.
 As Sharpe Group’s general counsel, Barlow Mann, JD, consults with some of the country’s most successful gift planning programs. He is recognized as an industry expert and is on the editorial board of Planned Giving Today. Follow Barlow on LinkedIn.
