After the Tax Reform Act of 1969, development executives sought to master the nuances of “qualified” charitable remainder trusts for the benefit of donors and the charitable organizations and institutions they wished to support. The ’69 Tax Act created a special category of charitable remainder trusts that would qualify for favorable tax treatment under specific provisions of the Internal Revenue Code and Regulations. While charitable trusts in other forms had been around for centuries, these new variations, named the Charitable Remainder Annuity Trust (CRAT) and Unitrust (CRUT), were codified as part of the Internal Revenue Code.
These new tax-exempt trusts would make annual payments to an individual(s) before eventually benefiting one or more charitable organizations. The payments could be fixed (CRATs) or variable (CRUTs) depending upon the type of trust selected. The donor funding the CRT would also be entitled to an income tax deduction based upon the value of the charitable gift calculated according to IRS rules. Because the trusts were tax-exempt, they could be funded with appreciated assets that could be sold and reinvested in a diversified manner with no capital gains due at the time of the sale. Payments received from these trusts were then taxed depending on the nature of the income. It was possible to receive portions of the payments free of tax or taxed at lower rates than would be paid on other sources of income.
In the post-Tax Reform Act of 1969 period, many nonprofits began to hire specialists to handle these trusts because of tax complexities. This trend, which continued throughout the 1970s and 1980s, in part contributed to the growth of what is often referred to as “planned giving.”
The elimination and curtailment of many other tax-advantaged activities in the mid-1980s led to increased interest in CRTs among allied professionals, including attorneys, accountants, financial planners, trust officers, and large segments of the financial services industry. After a brief learning curve, growing numbers of allied professionals were up to speed just in time for the extended bull market of the 1990s, which saw a significant increase in the popularity of charitable remainder trusts.
Recent returns
Now let’s look at the current status of CRTs. While CRT data was very limited for many of the early years of their existence, since 1998 the IRS has periodically released valuable information gleaned from tax returns for charitable remainder annuity trusts, charitable remainder unitrusts, pooled income funds, and charitable lead trusts. By examining figures from multiple years, fundraising professionals gain important insights into the relative attractiveness and use of these planning tools.
Between 1999 and 2005, the total number of charitable remainder trust returns grew from 85,060 to 116,446. The reported value of these trusts also increased from $64.3 billion to $104.6 billion. The following chart illustrates the growth in charitable remainder trusts reporting to the IRS.
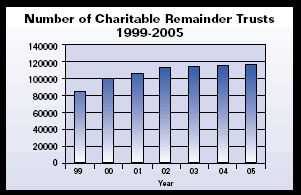
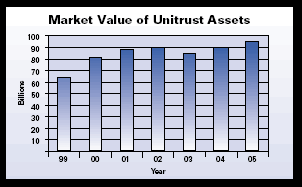
Based upon the number of CRT returns filed, there appears to be a slowing of the growth of charitable remainder trust activity in recent years. On the other hand, the fair market value of unitrust assets hit a record high of over $95 billion in 2005, reflecting overall gains in investment markets.
The IRS figures also provide a more specific breakdown of the number of annuity trusts and unitrusts:
The number of annuity trusts has been relatively flat over this 7-year period, with all of the growth driven by unitrusts. The number of CRAT returns ranged between 20,000 and 23,000 each year. Their book value was estimated between $9 billion and $10 billion. Between 2000 and 2005, the number of CRAT returns fell slightly from 22,669 to 22,626 and the book value dropped from $10.5 billion to $9.5 billion.
The number of unitrust returns continued to grow from 1999 to 2005, but the growth has stagnated in recent years. The number of CRUT returns grew from 64,923 to 78,293 from 1998 to 1999, an increase of over 20%. However, between 2003 and 2005, the number of CRUT returns grew from 91,374 to 94,779, just a bit over 3% in three years. Overall, since 2001, there has been very little growth in the number of both types of charitable remainder trusts.
Size of trusts
The IRS also provided information on the size of both types of charitable remainder trusts. The CRTs were divided into three categories:
- Small—asset values of less than $500,000
- Medium-sized—asset values of $500,000 up to $2,999,999
- Large—asset values of $3 million and up
Almost 18,000 annuity trusts were categorized as small, and fewer than 4,000 CRATs had a book value greater than $500,000. Less than 400 CRATs had a book value over $3 million.
Unitrusts showed a similar distribution with 63,145 falling into the small category, 24,124 in the medium-size group, and 3,336 in the large group.
Observations & data limitations
Taken collectively, the combined multi-year figures provide an interesting look at the recent history of charitable remainder trusts in America. After a period of rapid growth in the late 1990s through 2001, there has been slower growth in assets, although unitrust market values hit all-time highs in 2005. This growth has occurred in market values of pre-existing trusts as relatively few new remainder trusts have been created since 2001.
The strong stock market showing and involvement of allied professionals and the financial community helped fuel the accelerated growth, while declining equity markets and interest and dividend rates contributed to the deceleration. Between 2001 and 2004, it was difficult to generate income or gains necessary to make trust payments, plus potential donors were less likely to fund gifts in the aftermath of broad market declines.
Today, however, the Dow and broader stock market indexes are trading at or near record highs, and interest and dividend rates have increased substantially from the record lows of just a few years ago. Many prospective donors have seen their stock portfolios increase in value, yet they continue to be uncertain about the market’s long-term viability. Additionally, the donor pool as a whole is aging and growing numbers are entering or approaching retirement age, traditionally the period when donors fund CRTs. The idea of “giving out of the market” to fund a CRT for a term of years or life may thus enjoy renewed popularity for affluent and moderately wealthy donors.
As in the past, those in the 60 to 70 age range may be more attracted to a variable income plan such as a unitrust, while older prospects, or those utilizing a term of years trusts, may be more interested in an annuity trust. The rapid proliferation of gift annuity programs that offer fixed income and tax advantages similar to CRATs may mean that we will not see the renewed growth in CRATs that we might expect to see in the number of new unitrusts created. In the same vein, if interest rates rise, we may see renewed interest in pooled income funds as an alternative to CRUTs for persons who wish to make life income gifts using smaller amounts. Development executives who recognize the differing needs of their donors and develop relationships with them accordingly may help encourage a rebound in the popularity of CRTs.
Finding CRT prospects
Discovering those who may wish to create CRTs in today’s more favorable environment may be a bit like looking for needles in a haystack. The Sharpe Gift Planning Matrix™ may make the search easier.
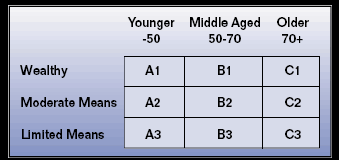
Even “small” CRTs are typically established with significant funds. The vast majority of all CRTs fall into the $100,000 to $500,000 range. Given the fact that most donors fund CRTs with a relatively small portion of their overall assets, most CRT donors will be found in the “Wealthy” boxes across the top of the Matrix. It is also apparent that while most CRT donors fall into the older category, a significant number also fall into the middle-aged category. In certain circumstances, CRTs may also appeal to a sub-set of wealthy, younger individuals. For example, those younger, wealthy donors in the A1 box might consider funding charitable trusts to benefit an older relative. Such donors could claim an income tax deduction and the older relative receives fixed or variable payments for life. Some in the B1 box may also be interested in this strategy, while others in the B1 box may benefit from a term of years trust to increase cash flow prior to tapping their retirement plans after age 70½. Those in the B1 box who have retired may elect to establish a CRT for life. Most of those in the C1 box will be considering CRTs that provide payments for life, but what if they die prematurely? To plan for that contingency, development officers might suggest establishing a CRT that will make payments for life, or a term of years (up to 20), whichever is longer. In this way, a donor may be able to balance both personal and philanthropic objectives.
With careful planning, the use of the Sharpe Gift Planning Matrix may help you to identify the most promising segment of your constituency who could benefit from various types of CRTs.
