Last fall, the Federal Reserve Bulletin examined changes in family finances from 2013 to 2016 based on the 2016 Survey of Consumer Finances. The report found broad-based gains in income and net worth since 2013. Because donors give from discretionary income and assets, these trends should be of interest to fundraisers.
Real growth of income and wealth
The real gross domestic product (GDP) grew at an annual rate of 2.2%. Unemployment fell from 7.5% to 5%. The positive economic performance resulted in gains for many families.
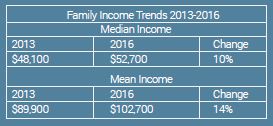
Between 2013 and 2016, median family income grew 10% and average family income grew 14%. The difference between the median and mean income growth indicates that families at the top of the income distribution range enjoyed the largest increases. Rising real estate values and stock market prices combined to increase both median and mean family net worth. Median family net worth grew 26%! These growth figures also reflect that larger gains were concentrated in households in the top quintile in terms of income and wealth.
A closer look at the figures
Overall, median income rose from $48,100 to $52,700, and the average family income grew from $89,900 to $102,700. While every age group experienced increases in income, the largest percentage income gains were found among those 75 and older.
Similar positive trends were reflected in family net worth. The wealth of all families grew during this period with median net worth increasing 16% to nearly $100,000 and the average rising 26% to almost $700,000. Once again, there were distinct trends based on age.
Median net worth steadily increased by age range with the 75+ age range topping out at over a quarter of a million dollars in 2016. The 75+ age group also had the second highest average net worth at just over one million dollars. Overall, the 55-64 age range had the highest average income and net worth in 2016.

What this means for giving
It appears that positive trends from 2013-2016 are continuing with household net worth reaching all-time highs in 2017 buoyed by real estate and stock market values. Unemployment has continued to drop to 3.8%, and family income may increase as a result. It is also clear that the increases are not spread evenly across the board and smart fundraisers will increasingly segment fundraising efforts based on giving history and other factors such as age and wealth. This will be especially true as a result of recent tax law changes that have created a greater need to target major and planned gift marketing communications to the right groups of your constituency at the right time in their lives to consider regular, special and planned gifts. ■
