According to a 2003 study by the Internal Revenue Service, there were more than 6.5 million “top wealth holders” in the United States in 1998. To qualify for this select group an individual needed to have gross assets of at least $625,000, the threshold at which federal estate and gift taxes applied in that year. Despite representing only 3.4% of the total population, this group held more than $11.1 trillion in assets, approximately one-third of total U.S. personal asset holdings.
It can be helpful for those involved with planned gift development activities to learn as much as possible about these “top wealth holders.” While there are limited sources of information about the personal wealth holdings of the general population, the IRS consistently provides accurate and timely information on these topics. One recent IRS study, “Personal Wealth, 1998” by Barry W. Johnson and Lisa M. Schreiber, offers valuable insights into the age, sex, marital status, asset holdings, and income of these “top wealth holders.”
A closer look
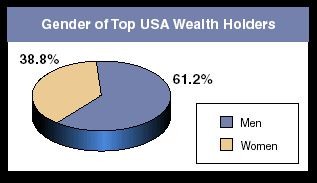
The group of 6.5 million adults that made up the top wealth holders in 1998 represented about 3.4% of the total adult population of the United States. The majority of this group, 61.2%, were men (see chart at right). Of the estimated 4 million men in this group, 1.7 million had a net worth of at least $1 million. Almost 70% were married, and 15% had never been married. Just 6.6% were widowers.
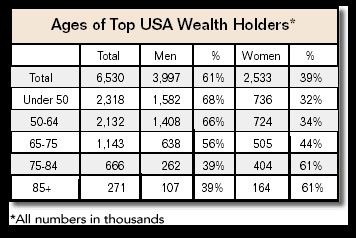
The 2.5 million women in this group had a total net worth of $4.2 trillion. Some 1.1 million of these women had a net worth of $1 million or more. About half of this group were married, and just under 30% were widowed. Almost 14% had never been married. It is important for gift planners to note that in the older age ranges where bequests and gift annuities are more likely to be planned, the ratio reverses to 61% women (see chart below and the page 1 article of this issue of Give & Take).
Wealth holdings
Among those with a net worth of less than $1 million, personal residences represented a larger percentage of overall holdings. There were also differences between the investment holdings of men and women. Men were more likely to own closely held stock and women publicly traded stock, for example. Among men with assets greater than $10 million, the majority of wealth was fairly evenly divided between closely held and publicly traded stock. Among women in this wealth range there was a much greater concentration of publicly traded stock.
Age and assets
Age plays a large role in determining an individual’s investment patterns (see chart above). The oldest wealth holders were not only more likely to be female, but they also tended to have a higher percentage of bonds, presumably because of retired persons’ greater need for income from investments. Younger wealth holders had a greater weighting in real estate and closely held businesses. Publicly traded stock was the dominant asset holding across all age groups and genders. Net worth also increases with age. The average net worth of male wealth holders under age 50 was $1.2 million, while the 85-and-over age group averaged nearly $2.5 million.
Importance of location
Geography also plays a role in wealth distribution. States with large populations like California, New York, Florida, and Texas had the greatest number of higher net worth individuals, but a higher percentage of the populations of New Jersey, Connecticut, Colorado, and the District of Columbia fell into this category. Over 50% of the group resided in only seven states—California, New York, Florida, Texas, Illinois, Pennsylvania, and New Jersey.
Over the years the level of concentration of wealth has also increased. The most recent study revealed the top 1% of the U.S. population held approximately 23.5% of total individual U.S. wealth, up from 21.3% 10 years earlier.
What this may mean
American top wealth holders are a diverse group and may be found in virtually every community but tend to be concentrated in certain areas of the U.S. They tend to be middle aged or older, with wealth and the likelihood of being female increasing with age. Men are more likely to possess wealth in the form of a closely held business, are more likely to be married, and are less likely to be widowed. On the other hand, over 25% of the women are widows and just under half are married. Women tend to own more publicly traded securities than men. These figures may help explain why more charitable bequests come from women (see page 1 for more on this subject).
Of the 6.5 million persons studied, only 2.7 million had assets in excess of $1 million. The majority, nearly 4 million individuals, fell into the $625,000-$999,999 net worth range and would no longer be subject to federal estate tax. These “near millionaires” probably do not consider themselves wealthy and are more likely to make gifts from income than from accumulated assets. Later in life they may be in a position to consider arrangements such as charitable gift annuities to enhance their income stream from accumulated assets. A greater number among this group must necessarily defer the ultimate expression of their charitable intent until the time of their death. The same may be true of many of the 2.7 million remaining who have assets that do not greatly exceed $1 million.
It is only among the “top wealth holders” that one is likely to find persons who are more receptive to six and seven figure deferred gifts. Some tend to make these gifts during their lifetimes, while others remain in an “accumulation phase” throughout their lifetimes and will only make gifts of this magnitude at death. Even among this group there seems to be a split of opinion as to when is the best time to make the “ultimate” gift.
Gift planners should be aware of this data as they plan their strategies for the future. Knowledge of wealth trends can also be helpful in determining how to proceed on a case-by-case basis. Carefully planning donor relations in light of overall trends can dramatically increase the number of people who agree to share their good fortune.
For more information, see the Winter 2003 issue of the IRS’s Statistics of Income Bulletin [Publication 1136 (Rev. 4-2003)].
