The American Association of Fundraising Counsel (AAFRC) Trust for Philanthropy has just released Giving USA 2005, which tracks charitable giving by Americans in 2004. According to the report, total giving in 2004 is estimated at $248.52 billion. This figure represents a 5% increase over 2003 figures, the largest jump since charitable giving reached its previous peak in 2000.
Even when adjusted for inflation, total giving in 2004 still grew 2.3% over giving in 2003. Such an increase indicates a recovery in charitable giving after inflation-adjusted giving dropped 1% from 2002 to 2003. In fact, 2004’s jump of 2.3% marks the first inflation-adjusted increase in total giving since 2000.
This is obviously good news for America’s nonprofit community, which has been laboring to raise funds in the wake of 9/11, subsequent investment market fluctuations, and a generally lackluster economy (see “Navigating Uncertain Seas” on page 1 of the June issue of Give & Take).
Breaking down the numbers
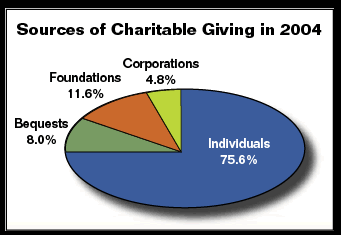
Of the $248.52 billion in total giving, 75.8% ($187.92 billion) comes in the form of gifts from living individuals. This marks an increase of 4.1% over the 2003 figure of $180.58 billion. When adjusted for inflation, the growth falls to 1.4% but still represents a rise from 2003.
For the purposes of the Giving USA report, individual giving figures are taken from estimated charitable deductions on tax returns and an estimate of giving by households that do not itemize deductions. The $187.92 billion figure represents estimates of gifts from itemized tax returns and non-itemizing households.
Bequests grew 9% in 2004 and represent 8% of total giving. Totaling $19.80 billion, this figure is derived from an estimate of both estates that are required to file an estate tax return and those whose total assets make them exempt from federal estate taxes. More than 40% of the total dollars given via bequests come from a relatively small number of estates—those valued at $20 million or more. When combined with gifts from living individuals, gifts from living and deceased individuals total $207.72 billion, or 83.6% of total gifts.
Gifts from foundations, excluding corporate foundations, total $28.8 billion (11.6% of total giving), while gifts from corporations, including corporate foundations, add another $12 billion, or 4.8% of total giving. Gifts from foundations and corporations each rose 7.3% in 2004. When adjusted for inflation, these figures drop to 4.5%.
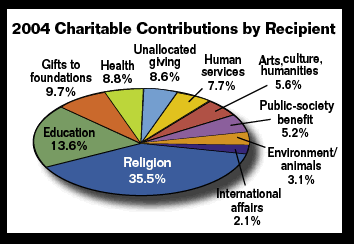
Where the money goes
Religious organizations normally receive the lion’s share of contributions, and 2004 was no exception with gifts to religious groups accounting for 35.5% of gifts ($88.30 billion). Educational institutions received 13.6% of 2004 charitable gifts, or $33.84 billion. Gifts to foundations (9.7%), health organizations (8.8%), and human services organizations (7.7%) round out the top five. All sectors of the charitable world saw an increase in giving in 2004, with environmental and animal welfare groups enjoying the largest rise (7%).
According to the annual Giving USA survey of charitable organizations, 55% of respondents reported a rise in giving in 2004. The size of the organization seems to indicate its fund-raising success in 2004, with larger institutions having the most success. 60% of large organizations, defined as those receiving $20 million or more in gifts, reported a growth in giving, while just under half of smaller organizations (revenues of under $1 million) enjoyed an increase. Of those organizations generating between $1 and $20 million, 55% saw a rise in giving in 2004.
Putting it in perspective
Giving USA also provides historical data that help put 2004 figures into perspective. When adjusted for inflation to 2004 dollars, charitable giving in the five years from 2000 to 2004 totals $1,232.04 billion. This figure represents a 30.4% rise over the $945.05 total from the dot.com boom years of 1995-1999. When adjusted for inflation, the increase falls to 26.8% but still shows strong growth.
Giving by individuals over the 2000 to 2004 period averaged 75.7% of total giving, which is slightly lower than in the previous five-year period, when individual giving averaged 77% and much lower than in the 1975-1979 figure of 83.4%.
The 2000 to 2004 period also saw bequests aver-aging 8.1% of total giving. This figure approaches the 40-year high of 9.4%, reached in 1970 to 1974 and is significantly higher than the 40-year low period of 1975-1979, when bequests represented only 6.6% of total giving.
The Giving USA report also calculates giving as a percentage of the gross domestic product (GDP). In 2004, total giving was 2.1% of the GDP, which is higher than the 40-year average of 1.9%. Since 1997, total giving has been at a level of 2% of GDP or higher, including the high of 2.3% in 2000 and 2001.
Giving in relation to income
Data from the report also put individual giving in perspective in relation to personal income. Even after adjusting for inflation, personal income rose by 2.8% in 2004. However, individual giving in 2004 represents 1.9% of personal income, the lowest since 1999. As a percentage of disposable income, individual giving remains at 2.2%, where it has been since 2002.
The Giving USA report points to disappointing investment returns to explain the failure of individual giving to rise with personal income. Investment earnings in 2004 grew at a relatively low rate of growth of 6.7%, which is far below the 40-year average of 16%.
Last year was a presidential election year, which can lead many to designate a certain amount of discretionary income to political campaign donations. However, Giving USA reveals no noticeable impact on charitable giving as a result.
Implications for development executives
Giving USA 2005 contains a wealth of information about the sources of charitable giving and the types of organizations receiving these funds. It may be helpful to use these figures to place one’s organization in relation to its peers, while keeping in mind that many of these figures are estimates.
The increase in giving in 2004, despite lackluster stock markets, is good news for those responsible for encouraging voluntary funding. The fact that donors are giving more—even when they may feel some-what less secure in their own finances—highlights an essential truth about the American populace: They are always willing to make gifts of their time and money to support the causes in which they believe.
Given the fact that many persons have a desire to give—for many reasons—nonprofits should give donors every opportunity to discover how they can give while reaching their personal, philanthropic, and financial goals.
That task includes providing suitable information to their constituents on an age- and wealth-appropriate basis. For example, a bequest mailing that may be well received by older donors may leave younger persons cold. In the same vein, those in the Boomer generation may benefit from information about ways to use various planned giving tools to fulfill multiple obligations, such as using remainder trusts to help prepare for retirement or to provide funds for college tuition (see page 4 for more on this topic).
All donors may be interested to learn how year-end gifts can help them reduce their 2005 tax burden. Consider contacting your donors this fall through special year-end giving communications. See page 7 and the enclosed year-end giving materials for more details.
The latest Giving USA statistics prove that Americans continue to give generously to the nonprofit sector. It is the job of all development executives to do what they can to help their organizations increase their share.
Editor’s note: To learn more about how to maximize gifts to your organization, attend one of Sharpe’s popular seminars. See page 3 for more information.
