By: Barlow Mann
With the stock market at an all-time high, gifts of securities may be particularly attractive for some donors.
According to the Summer 2016 IRS Statistics of Income Bulletin, the agency’s most recent report, individual taxpayers who itemized deductions reported $51.6 billion in noncash charitable contributions in 2013. This figure represented over 25 percent of all itemized gifts and 21 percent of all individual gifts reported by Giving USA for 2013. About one third of those taxpayers reported gifts in excess of $500 on IRS Form 8283, totaling $46.4 billion, or some 90 percent of overall noncash contributions.
Stocks lead the way
Corporate stock contributions increased at more than twice the rate of total noncash contributions, rising 17.7 percent to almost $20 billion for 2013. The average stock contribution was $143,369 for the year.
In a sign that real estate continues to recover from the aftermath of the Great Recession, gifts of real estate, lands and easements grew 13 percent from $2.75 billion in 2012 to $3.1 billion in 2013. The average gift of property interests, per tax return, was $180,000.
 Income issues

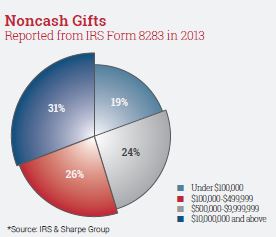
Just under 20 percent of the noncash gifts reported on IRS Form 8283 came from returns under $100,000. Another 25.9 percent came from returns in the $100,000 to $499,999 range. Higher income returns accounted for the majority of all noncash gifts, with returns from incomes between $500,000 and $10 million, representing 24 percent, and those over $10 million, representing 30.6 percent of the total.
Age and noncash gifts
It should be no surprise to Sharpe clients and Give & Take readers that taxpayers age 65 and older gave the most in terms of total charitable contributions (both cash and noncash) reported on schedule A of individual tax returns. The 65-and-older group also reported $17.3 billion in noncash contributions, or 37.3 percent of the $46.4 billion reported on form 8283.
These mature itemizers also had a larger average gift and gave a higher percentage of their adjusted gross income when compared to other age brackets. In fact, the older donors were more than twice as generous per capita. Their “average gift reported” and “donation as a percent of AGI” were more than twice as high as the next most generous age group, 55 to 64. Over half of the total amount of noncash gifts came from individuals 55 and older.
As economic recovery continues, both real estate and publicly traded stocks have grown in value, leading to record levels of household wealth in America. However, recovery has been uneven, and many of those who have experienced an increase in asset values, including stock, real estate and other property, tend to be among the wealthier 55-and-older age group.
Getting your share
Sharpe Group has several tools to help you show donors the benefits of making charitable gifts through appreciated securities and how to structure such giving, including the popular Giving Securities booklet. For more information, visit www.SHARPEnet.com/stock-gifts-tools.
Barlow Mann is Chief Operating Officer for Sharpe Group.
