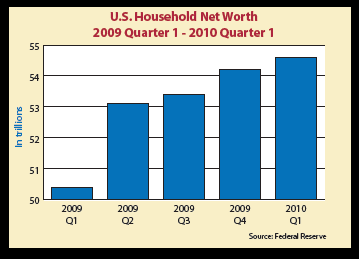
According to the Federal Reserve Board, American household net worth, which measures the difference between the value of assets and liabilities, has risen each of the last four quarters! (See chart below.) Several other reports substantiate the increase in the number of millionaires and other high-net-worth individuals who fill the ranks of major donors for almost all nonprofit and charitable organizations.
According to Giving USA studies and IRS figures, a large percentage of overall giving each year comes from wealthier, high-income taxpayers who itemize their charitable deductions. Most charitable organizations receive the majority of gifts in the second half of the year and the lion’s share of those gifts in the final quarter of the year. Charity Navigator’s December 2008 Year-End Giving Survey found that the median percentage of charitable gifts received between Thanksgiving and New Year’s Eve is 29%. Larger charities—those with budgets in excess of $13.5 million—reported an even greater dependence on year-end giving. Naturally, many fundraisers are excited about what the recent rise in American wealth may mean for charitable giving in 2010.
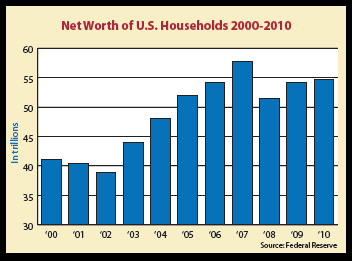
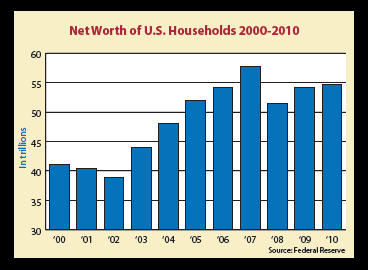
Overall, American household wealth actually peaked in the third quarter of 2007 at $58.6 trillion and then began to decline in the fourth quarter of 2007 as the current recession began. Starting with the fourth quarter of 2007, household net worth of Americans declined for six straight quarters as the recession deepened with the stock market meltdown of the first quarter of 2009. This trend had reversed by the end of the second quarter of 2009, when Americans experienced the first increase in household net worth since the all-time peak value was reached in 2007.
While still below pre-recession “bubble” valuations, household net worth now exceeds 2006 levels. This upswing has been accompanied by a substantial increase in the high-net-worth segment of the general population. According to the Spectrem Group Affluent Market Research, the number of U.S. households with a net worth of $1 million or more (excluding the primary residence) grew 15% to 7.8 million in 2009. Similarly, the number of ultra-high-net-worth households, or those with a net worth of $5 million or more excluding the primary residence, increased 17% to 980,000 households in 2009. These results are validated by the Merrill-Lynch Capgemini World Wealth Report, which measures wealth differently but found a similar 17% growth in the ranks of the wealthy.
While it may be premature to celebrate the return of major gift donors and prospects, the rebounding growth of the affluent population and their wealth provide a reason for optimism this fall. According to IRS data, higher-income taxpayers with adjusted gross incomes of $200,000 or more account for between 40% and 50% of all charitable deductions claimed on tax returns.
Gifts of stock
The affluent population is also more likely to make gifts in the form of securities and other publicly traded securities. In 2007, the most recent year that IRS data is available, charitable contributions of corporate stock totaled $23.7 billion, representing 44.9% of reported noncash contributions. The value of stock gifts dwarfed all other categories of noncash gifts, with more than three times the dollar amount of the next closest category. The average value of corporate stock donations was over $100,000. It is interesting to note that in some years the total value of securities contributed exceeds the amount of bequest income reported.
An additional item of interest to development executives is that over 97% of gifts of corporate stock and mutual funds came from taxpayers with incomes greater than $100,000. Age also appeared to be an important factor. While every age category was represented among noncash charitable contributions, overall noncash contributions rose dramatically with age and peaked after age 65.
This information would seem to suggest that major gift stock solicitation strategies should focus most of their efforts among higher-income donors, primarily in the B1 and C1 boxes of the Sharpe Gift Planning Matrix©. But do not overlook a relatively small number of younger high-net-worth donors found in the A1 box who could make a significant contribution of stock.
See page 5 for information about Sharpe’s newest publication that is designed to provide high-net-worth donors with the information they need to maximize their giving in 2010.
For detailed information about noncash charitable giving in 2007, consult the Spring 2010 issue of Statistics of Income Bulletin at www.irs.gov.
