
by Barlow T. Mann, Executive VP and Chief Operating Officer
Because wealth, age and marital status are important factors in an individual’s charitable giving capability, national trends are helpful in determining your marketing plans in relation to the data you have on your donors.
The Winter 2019 Statistics of Income Bulletin provides a glimpse of America’s top wealth holders from the IRS’s perspective. The article “Personal Wealth, 2013” estimates 548,000 adults with gross assets of $5.25 million or more in 2013 represented the top one quarter of 1% of all adult wealth holders in the U.S. After subtracting their debts, the group’s combined net worth totaled $6.9 trillion, more than 10% of the total U.S. net worth that year.
Distribution by age and gender
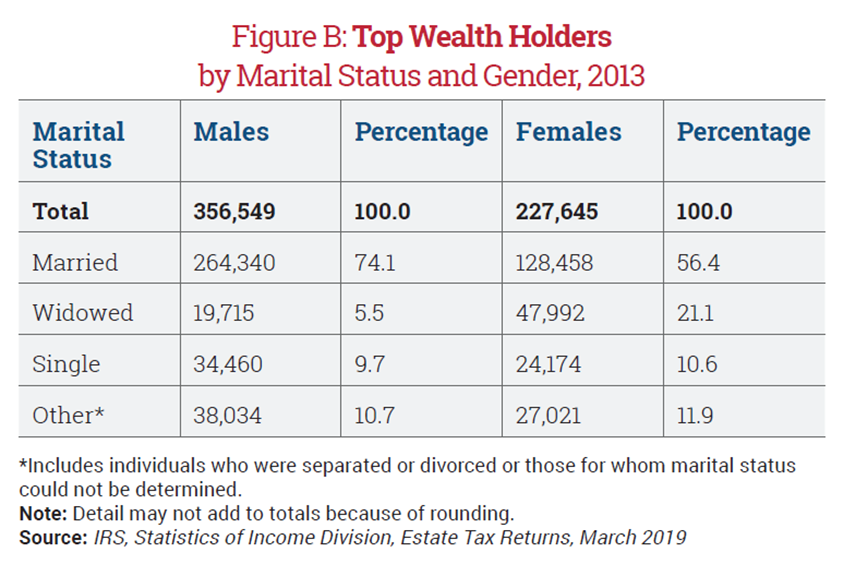
The IRS estimates 60% of the top wealth holders in 2013 were men. This amounted to roughly 357,000 males and 228,000 females. While the bulk of top wealth holders of either gender fell into the 50-to-80 age range, men were more concentrated in the younger age ranges while women were more represented in the older age groups. Among the oldest of the old, those 90 and older, women outnumber men 10,805,000 to 9,663,000.

Marital status and asset distribution
Nearly 75% of ultrawealthy men were married versus just over half of women. Conversely, 21% of women were widowed versus just 5.5% of men. The remainder of males and females were either single or other (divorced, separated, etc.).
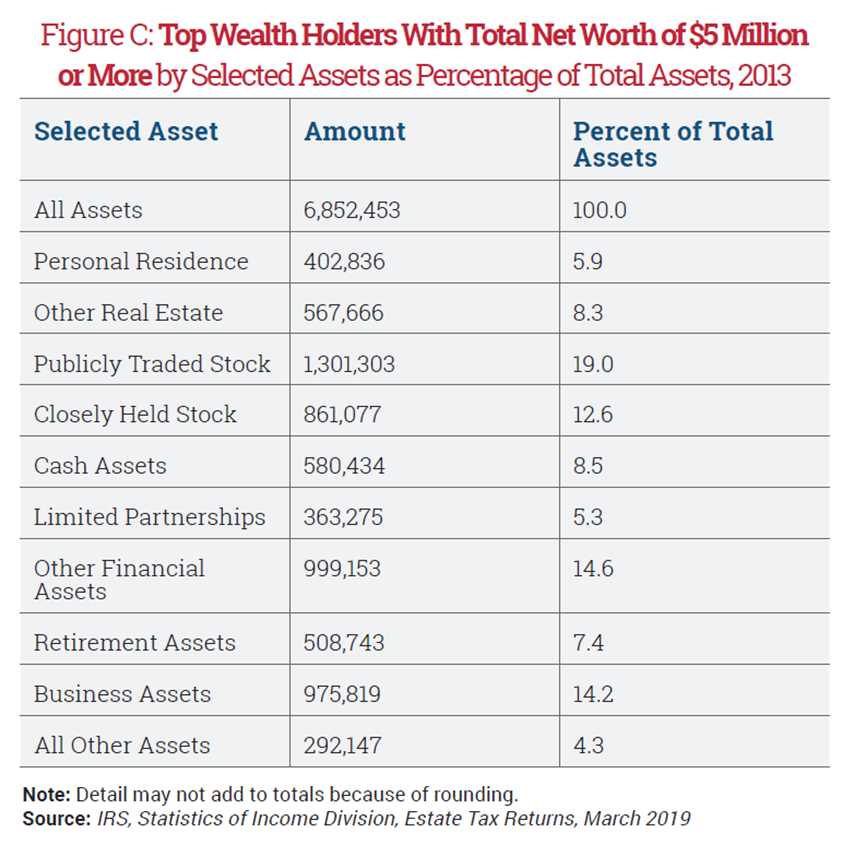
The largest asset holding of top wealth holders tended to be stock, both publicly traded and closely held. Together they totaled 31.6% of total assets; the next three largest asset categories included other financial assets (14.6%), business assets (14.2%) and cash (8.5%). The remaining roughly 31% of assets was divided among personal residences, other real estate, limited partnerships, retirement assets and other holdings.
Observations on the 80/20 rule
Being aware of the characteristics of America’s top wealth holders and the remainder of the top quintile of the affluent population will be critical to those responsible for attracting significant gifts over the next decade. Those familiar with the Pareto principle understand that the top 20% of people often provide 80% or more of sales or gifts. Marketing segmentation based on information such as a donor’s age, gender, wealth, marital status and giving history will allow better targeted communications to those who have the capacity to make larger regular, special/major and ultimate gifts to their favorite charitable causes, organizations and institutions.
If you are not sure who your top 20% are, see “How Well Do You Know Your Donors?” in the November/December 2019 Give & Take, click here for more information on data enhancement services or contact us at 901.680.5300 or info@SHARPEnet.com.
